Skills in Action
Projects

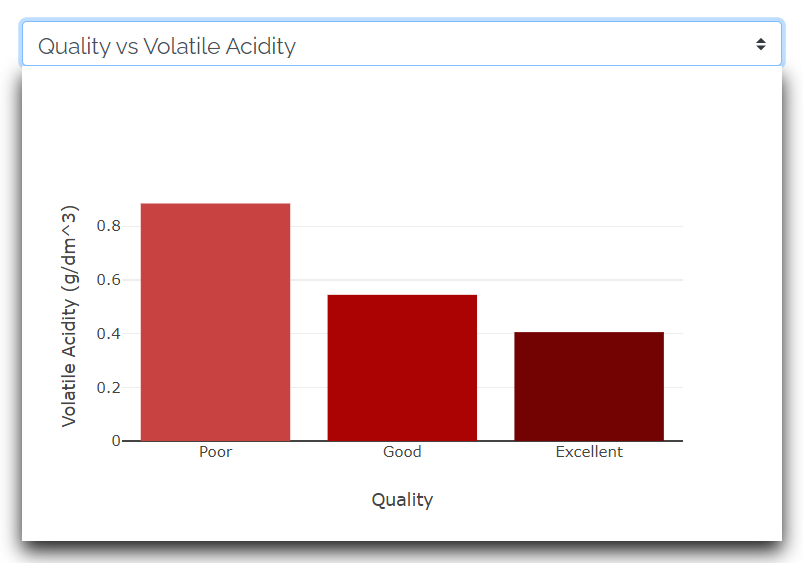
Wine Quality Prediction
A 4-person project using the UCI machine learning wine quality dataset to create an interactive
app for prospective winemakers to test expected wine quality based on physicochemical components.
Tools used: Javascript, Plotly, Flask, HTML/CSS

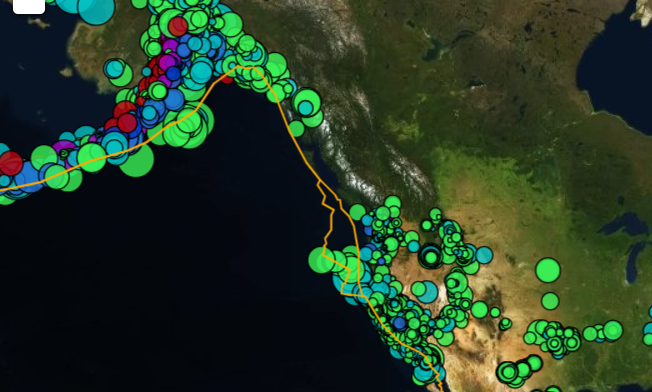
Earthquake Map
Interactive map of the last 30 days of earthquake activity using current USGS data.
Tools used: Javascript, D3, geoJSON API, Leaflet, Mapbox, HTML/CSS
Take a look at the code.

Bacteria Study Dashboard
Interactive dashboard visualizing subject data from a study looking into bacteria types present in navel samples.
Tools used: Javascript, Plotly, D3, HTML/CSS
Take a look at the code.

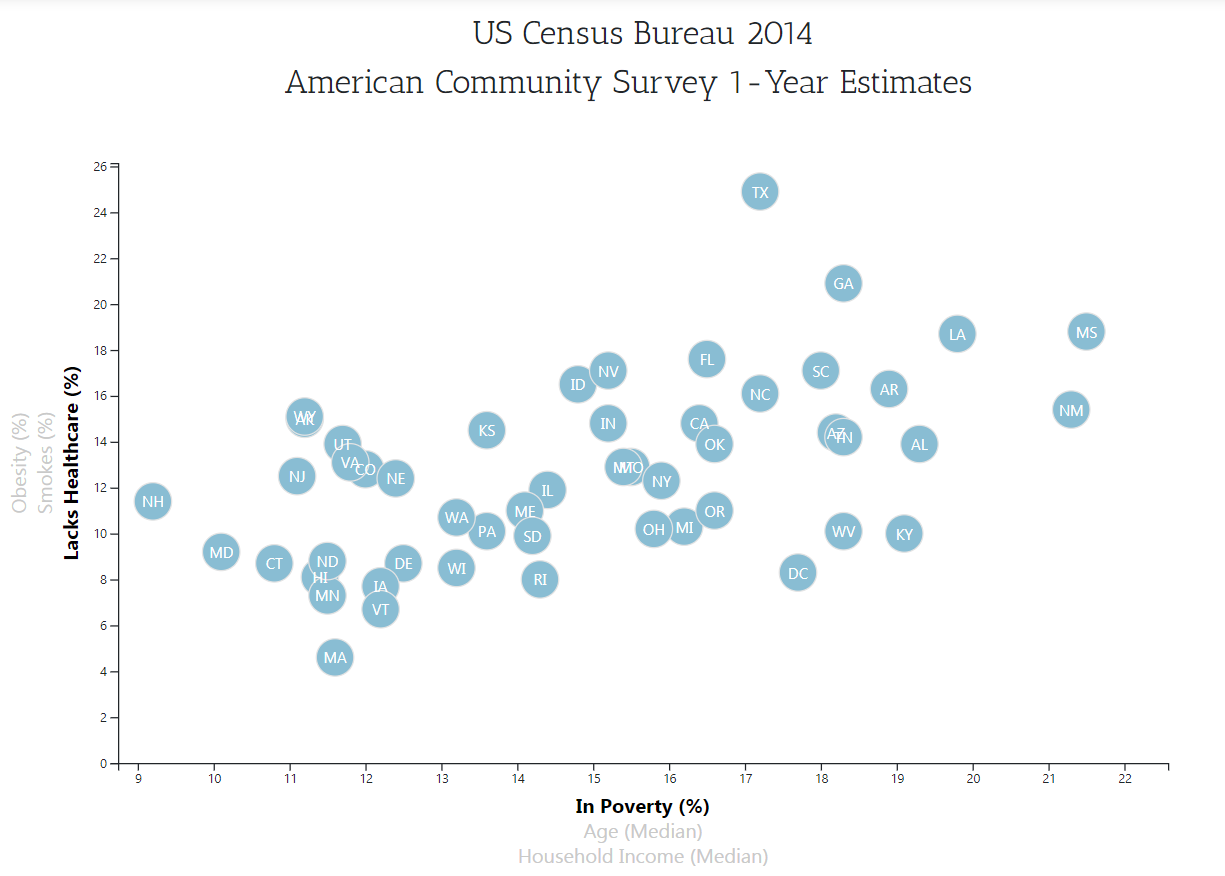
Multi-axis Census Plot
Interactive scatter plot with multiple, changeable axes comparing health risk factors.
Tools used: Javascript, D3, HTML/CSS
Take a look at the code.
